Power BI Consulting Company

Kaustubh Mishra
Date:17 September 2024
Power BI Consulting Company: Empowering Businesses with Data-Driven Insights
In today’s competitive landscape, organizations need actionable insights to stay ahead. Power BI, a powerful business intelligence tool by Microsoft, enables companies to transform raw data into valuable insights through interactive reports, visualizations, and real-time dashboards. As a leading Power BI consulting company, Mismo Systems specializes in helping businesses in India—including Noida, Delhi, Bangalore—and the USA leverage Power BI to drive smarter decision-making and improve overall efficiency.
Why Choose Mismo Systems for Power BI Consulting Company?
- Expert Power BI Consulting At Mismo Systems, we provide end-to-end Power BI consulting services, from data integration and dashboard creation to advanced analytics. Our team of certified consultants has deep expertise in Power BI, helping businesses maximize the tool’s potential to transform complex data into meaningful insights.
- Tailored Power BI Solutions Every business has unique data challenges. We offer customized Power BI solutions to address your specific needs—whether you need interactive dashboards, custom reports, or advanced analytics. Our solutions are tailored to fit your organization’s goals, ensuring you make informed, data-driven decisions.
- Seamless Data Integration Our consulting services include seamless integration of data from multiple sources—whether from cloud, on-premises systems, or third-party applications. We ensure that all your critical data is accessible in one place, enabling you to analyze and visualize data efficiently in Power BI.
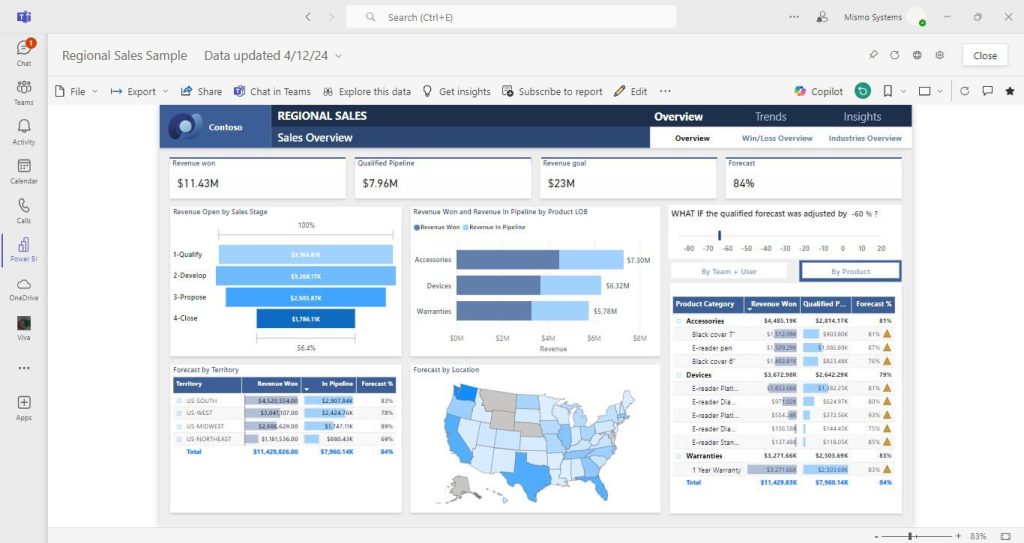
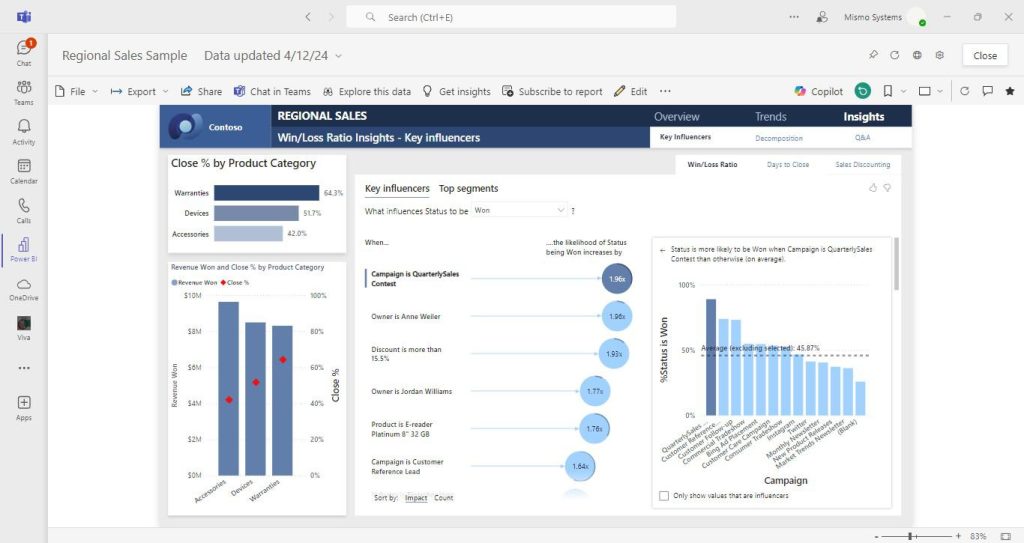
- Custom Dashboard and Report Development We create custom Power BI dashboards and reports that align with your business objectives and key performance indicators (KPIs). These real-time, interactive dashboards allow decision-makers to gain a clear, actionable view of business performance and trends, ensuring you stay ahead of the competition.
- Advanced Analytics and Predictive Modeling Our Power BI consulting goes beyond basic reporting. We help businesses unlock the power of advanced analytics and predictive modeling, providing deep insights that help forecast future trends and drive strategic decision-making.
- Power BI Embedded Solutions Mismo Systems specializes in embedding Power BI solutions into your existing applications or websites, providing a seamless user experience. This allows your team and customers to access reports and data visualizations within familiar platforms, driving greater engagement and value.
- Training and Support We offer comprehensive training to ensure your team can fully leverage Power BI’s capabilities. From basic report generation to advanced data analysis, we empower your employees to utilize Power BI effectively. Additionally, we provide ongoing support to ensure your Power BI environment remains optimized.
Power BI Consulting Company for Businesses in India and the USA
With a strong presence in major Indian cities like Noida, Delhi, and Bangalore, along with expertise serving businesses in the USA, Mismo Systems is well-positioned to offer Power BI consulting services tailored to regional and global businesses. Our experience spans across industries such as healthcare, finance, retail, and technology, delivering industry-specific Power BI solutions that meet your unique business needs.
Benefits of Choosing Mismo Systems as Your Power BI Consulting Partner:
- Deep Industry Expertise: We have successfully implemented Power BI solutions across a range of industries, giving us the insight needed to tackle diverse business challenges with customized solutions.
- Scalable Solutions: Whether you are a startup or a large enterprise, we offer scalable Power BI solutions that grow with your business. Our services are designed to adapt to your evolving data needs as your business expands in India and beyond.
- Comprehensive Support: Our Power BI consulting services extend beyond implementation. We offer continuous support to ensure your BI environment is optimized and running smoothly, allowing your business to remain agile and data-driven.
- Global and Local Expertise: With a presence in both India and the USA, Mismo Systems combines local expertise with a global perspective, delivering solutions that cater to regional and international business environments.
Unlock the Power of Your Data with Mismo Systems
As your trusted Power BI consulting company, Mismo Systems is committed to helping your business unlock the full potential of its data. With our comprehensive Power BI solutions, we transform raw data into strategic assets, empowering your organization with the tools and insights needed for success.
Contact us today to learn how our Power BI consulting services can drive data-driven transformation for your business.




Comments On "Power BI Consulting Company"
Leave a Reply Cancel reply
Recent Blogs
May
01
2025
From Data to Decisions: How Data Analytics is Transforming UK Enterprises
Introduction Imagine knowing what your customers want before they even realize it. What if you could anticipate market trends, optimize
Apr
29
2025
Effective Multi-Cloud Management: Security, Cost Optimization, and Strategy
Mastering Multi-Cloud Management in 2025: Centralization, Security, Cost, and Automation Introduction The multi-cloud management platform market reached $13.33 billion in
Apr
09
2025
Power BI in 2025: Latest Features, Trends & Best Practices
Introduction In the fast-changing business intelligence landscape, data is much more than simple digits—it lays the cornerstone for tactical choices.
Mar
21
2025
Azure Landing Zones: Build Secure, Scalable Cloud Foundations
Want to build a secure, scalable cloud setup? Discover how Azure Landing Zones create a strong foundation for your cloud

Mar
13
2025
Advance Analytics with Microsoft Fabric
Unlock the full potential of Microsoft Fabric and take your analytics game to the next level! In this exclusive webinar,

Feb
24
2025
How to Migrate VMware to Azure? Plan, Execute and Optimize Your Migration using Azure.
For several years, VMware solutions have been at the forefront of the business world, trusted as the virtualization platform powering
Feb
17
2025
Microsoft Fabric Architecture Guide 2025 – Key Insights & Features
Microsoft Fabric is an integrated analytics and data platform designed to meet the needs of large enterprises. It combines various
Jan
27
2025
Ensuring Optimal Active Directory Health, Security, Performance, and Upgrades
Active Directory Domain Service (AD DS) is widely used directory service and foundation of Windows domain network in organizations. It
Jan
20
2025
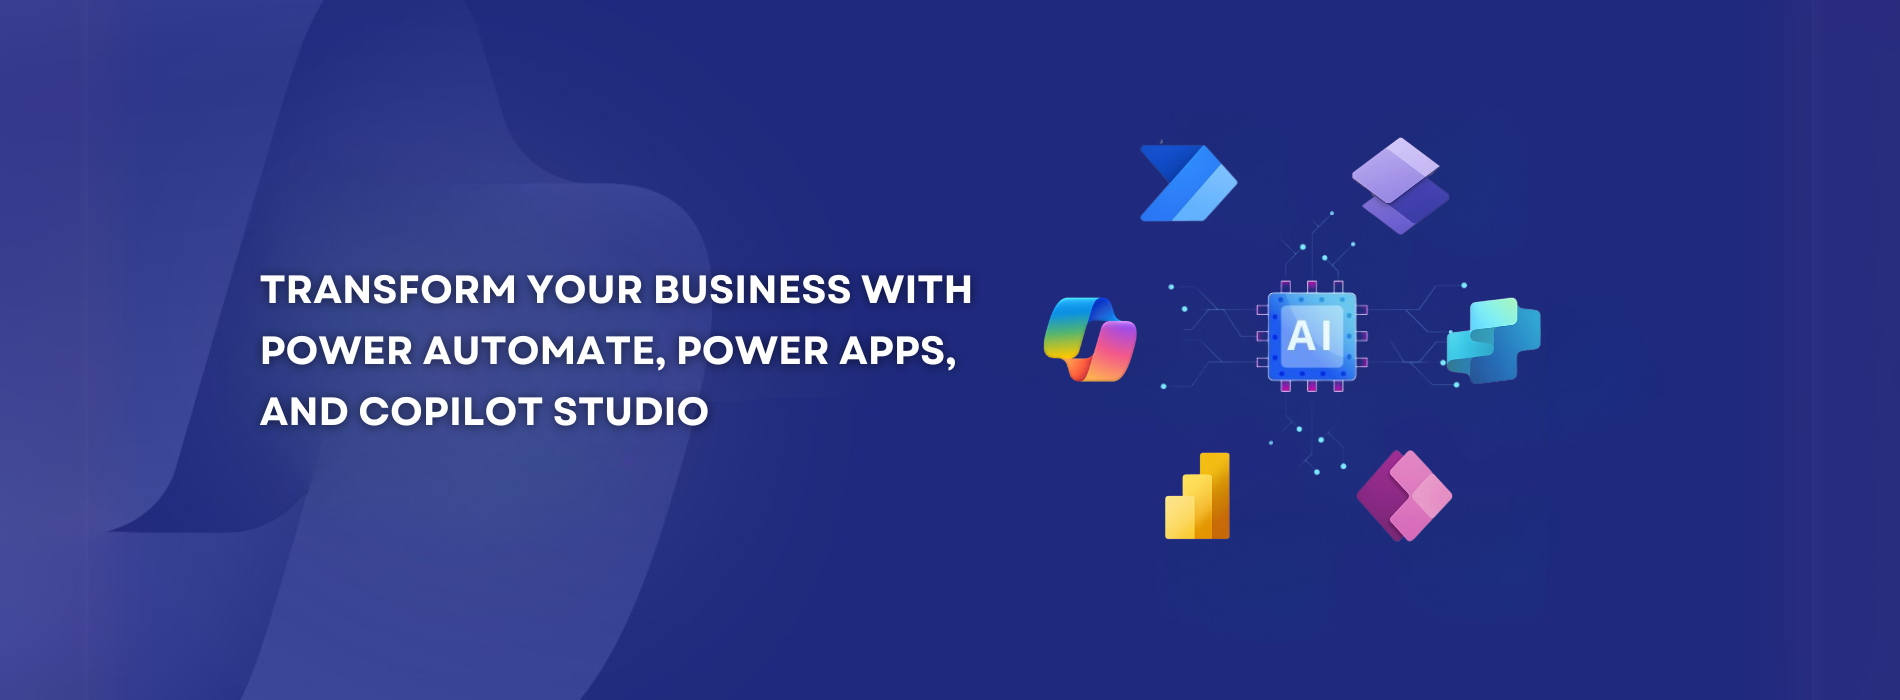
Transform Your Business with Power Automate, Power Apps, and Copilot Studio
Microsoft’s Power Platform is a robust suite of tools designed to empower businesses to innovate and transform their operations. It
Jan
09
2025
How to Manually Migrate a WordPress Website from One Host to Another
Migrating a WordPress website from one host to another can seem daunting, but with a step-by-step guide, the process becomes

Dec
18
2024
A Stress-Free Guide to Setting Up Your Azure Environment
It’s like going on an adventure when you start your cloud journey. It may make you happy, but if you’re

Dec
18
2024
Microsoft Fabric Uncovered Capabilities Advantages
In this blog we will dive into Microsoft Fabric and go over the core services offered on the Fabric platform.

Nov
18
2024
MS Fabric and the Future of Predictive Analytics: What to Expect
Uncover how MS Fabric is transforming predictive analytics and what innovations lie ahead for businesses and technology.

Nov
12
2024
Unlock the Power of AI with Microsoft Copilot Studio
In this webinar, we dive deep into Microsoft’s transformative AI technology and show you how to create custom AI assistants
Nov
07
2024
Power BI for Business Success: Making Data-Driven Decisions Easy
Learn how to make the most of Power BI’s sharing functionalities to drive impactful data-driven decisions.

Nov
07
2024
Setting up High Availability and Disaster Recovery for Enterprise Applications
Learn how to ensure business continuity, minimize downtime, and protect your critical systems with best practices for HA and DR.

Nov
07
2024
Analytics Unplugged: From Raw Data to Actionable Insights
Dive into the world of Data Analytics and discover how to harness the power of data for smarter decisions and

Nov
07
2024
Overcoming Cloud Migration Challenges
Cloud migration offers numerous benefits, but it also comes with its own fair share of challenges Delve into the most

Oct
18
2024
Rescuing Important Emails from the Junk Folder with Microsoft Graph API
Introduction: Because, Of Course, It Had to Be the CEO Let me paint you a picture: we were managing the

Oct
07
2024
Cloud Adoption Challenges
Tune in for a deep dive into overcoming hurdles in cloud adoption using real-world solutions from our co-founder, Vineet Arora.

Sept
17
2024
Power BI Consulting Company
Power BI Consulting Company: Empowering Businesses with Data-Driven Insights In today’s competitive landscape, organizations need actionable insights to stay ahead.

Sept
17
2024
Power BI Partners
Power BI Partners: Driving Data-Driven Solutions As a trusted Power BI partner, Mismo Systems is dedicated to empowering organizations with

Sept
17
2024
Power BI Development Company
Empowering Data-Driven Insights in India (Delhi, Noida, Bangalore) and USA In today’s digital landscape, businesses are generating vast amounts of

Sept
17
2024
Power Bi Development Services
Power BI Development Services: Unlocking Data-Driven Success At Mismo Systems, we offer specialized Power BI development services to help organizations

Sept
10
2024
Power BI Service for Enterprise Analytics
In today’s data-driven business landscape, enterprise analytics plays a crucial role in informed decision-making and maintaining a competitive edge. Microsoft’s

Sept
10
2024
Planning Your Legacy Application Migration to Containers
This blog post is in continuation to “Why Migrate Legacy Applications to Containers and What are the Challenges this Brings?”

Aug
05
2024
Azure AI, ML Studio & OpenAI: Simplifying Microsoft’s AI Ecosystem
In today’s rapidly evolving technological landscape, integrating artificial intelligence (AI) and machine learning (ML) into business operations is no longer

Aug
05
2024
Why Migrate Legacy Applications to Containers and What are the Challenges this Brings?
Introduction to Containerization Containerization is the era to welcome: a time where complexity would confront simplicity in the field of

Apr
18
2024
Azure Log Analytics Workspace – Ensuring Compliance, Centralizing and Streamlining Monitoring
In the realm of cloud computing, the ability to monitor, analyze, and respond to IT environment anomalies is crucial for

Apr
17
2024
Azure Stack HCI 3-node Cluster Configuration – Switchless Storage Network
Mismo Systems implemented a 3-node Azure Stack HCI cluster for one of the clients. The cluster was configured with a

Oct
04
2023
Microsoft update: Chat with users with Teams personal accounts
Chat with Teams will extend collaboration support by enabling Teams users to chat with team members outside their work network
Dec
01
2022
AWS vs Azure
The cloud service providers AWS and Azure are truly miraculous helping millions across the globe creating a virtual space with

Apr
25
2022
The need for a hybrid solution – Azure Stack HCI
Microsoft’s Azure Stack HCI is a hyper-converged infrastructure with virtualization, software-defined networking, and more. What separates it from the rest

Jan
10
2022
Azure Virtual Desktop vs Windows 365
Azure Virtual Desktop (AVD) is a Desktop as a Service (DaaS) solution offered on Microsoft Azure, previously named Windows Virtual

Nov
16
2021
AWS Update:- Amazon EC2 now supports access to Red Hat Knowledgebase
Starting today, customers running subscriptions included Red Hat Enterprise Linux on Amazon EC2 can seamlessly access Red Hat Knowledgebase at

Nov
16
2021
AWS Update:- Amazon SNS now supports token-based authentication for APNs mobile push notifications
For sending mobile push notifications to Apple devices, Amazon Simple Notification Service (Amazon SNS) now enables token-based authentication. You may

Nov
16
2021
AWS Update:- Amazon ECS now adds container instance health information
Customers may now see the health of their compute infrastructure using Amazon Elastic Container Service (Amazon ECS). The customers running their

Nov
16
2021
Microsoft 365 Update:- Viva Connections is now generally available!
Viva Connections, part of Microsoft Viva, is your entry point to a modern employee experience. You get an all-in-one experience with the customized

Nov
16
2021
Microsoft 365 Update:- Meeting Activities in Teams Audit Log
Meeting Activities have been added to the Microsoft Teams audit log to help organizations respond more effectively to security events, forensic investigations,

Nov
15
2021
Azure Update:- Global Disaster Recovery via Azure Site Recovery
Azure Site Recovery is a Cloud-driven, highly innovative, and automated disaster recovery solution (DRaaS). Azure’s native platform capabilities for high

Nov
15
2021
Azure Update:- Screen Capture Protection for Azure Virtual Desktop
Azure Virtual Desktop is a service running in the cloud that enables your users to access the data, applications, and

Nov
15
2021
Azure Update:- Immutable Storage with versioning for Blob storage
Azure blob storage is massively scalable and secure object storage for cloud-native workloads, archives, data lakes, high-performance computing and machine

Nov
10
2021
How is Cloud transforming Industries?
Cloud technology has been impactful in transforming business. From cost savings to easy collaboration, the usage of the Cloud has

Sept
27
2021
4 Tips for Protection Against Unsafe Emails
Earlier, the spotting of malicious content in emails was quite an easy task. However, due to the rise in technology,

Sept
24
2021
How is hybrid cloud useful for midsize/large businesses?
A hybrid cloud can be defined as a cloud computing environment that utilizes a combination of on-premises private cloud and

Sept
22
2021
How to Protect Your Data from a Ransomware Attack
What is a Ransomware attack? It can be defined as a malware attack that is carried out deliberately to encrypt

Aug
24
2021
Build superpower apps, with no code-Power apps
PowerApps is a tool that allows you to create custom apps, leveraging many of the features of the Office 365

Aug
11
2021
Why do you need a Modern Workplace – M365?
Microsoft 365, a world of enhanced productivity and collaboration that drives a team to achieve more together, is a complete

July
02
2021
Microsoft Teams Updates (June 2021)
In this blog, we will be discussing the various Microsoft Teams updates in the month of June. Meeting Updates: During

June
22
2021
Microsoft rebrands Windows Virtual Desktop as Azure Virtual Desktop
Microsoft’s virtual desktop infrastructure platform has been rebranded under the Azure name and notified of new security and management capabilities

May
07
2021
How Startups can succeed with Cloud Computing?
Startups are an enjoyable but demanding professional experience. A host of entrepreneurially dedicated professionals pursue their passion and dive into

May
04
2021
Azure AD SSO & AWS – Connecting the Rivals
Being part of Mismo Systems, I am fortunate enough to get to work on a diverse set of projects. Few

May
04
2021
A quick look at the 4 Most Used Services on Microsoft Azure
1. Azure Compute Azure compute is an on-demand computing service for running cloud-based applications. Azure compute service can be divided broadly into three

May
01
2021
Cloud Security – A shared responsibility
We see all businesses small or big, consuming cloud technology in one or another way. The pandemic has increased the

Apr
18
2021
Breakout Rooms and Its Usage – Microsoft Teams
In this blog, we are going to discuss a feature provided by Microsoft teams known as Breakout rooms. Also, we

Apr
12
2021
Is Cloud cheaper than On-premises Data Centres?
Cloud has bloomed over the last decade, according to Goldman’s analysts almost 23% of IT workloads now live on Public

Apr
04
2021
Amazon CloudFront
Amazon CloudFront is a brisk Content Delivery Network (CDN) service that safely transfers data, videos, applications, and Application Programming Interface

Apr
04
2021
Hosting with Transparency, Compliance, and Security
We help customers host applications on the cloud, this includes accounting systems including Tally, ERP software including SAP, and Navision.

Apr
04
2021
Future of Cloud Computing
Cloud computing has established itself as the inevitable future when it comes to IT services. This picture becomes much clearer

Apr
04
2021
AWS Security Features
The Amazon Web Services (AWS) in terms of security follow a shared responsibility model. So, the security ‘of’ the cloud is on

Mar
14
2021
Azure vs AWS
It’s Azure vs AWS!! Read this blog to know the major differences between Azure & AWS. What is Azure? Microsoft

Mar
04
2021
Amazon FSx – How can it help you?
The Amazon FSx has a very efficient way of deploying and running traditional file servers in the cloud that is

Mar
04
2021
What is Budget in Azure and how can you set the Budget?
Budget in Azure to manage and monitor the spending or consumed cost for Azure services. We can apply budget on

Feb
23
2021
DevOps with AWS
What is CI CD? Continuous Integration Developers work on the code which is stored in a code repository. Code repository

Feb
09
2021
Azure Firewall
Azure Firewall is a managed, cloud-based network security service that protects your Azure virtual network resources. You can centrally create,

Feb
04
2021
AWS Directory Service: The Amazon Cloud Active Directory!
The AWS Directory Service provides several ways to use the Microsoft Active Directory (AD) with other AWS utilities. Information regarding

Feb
03
2021
Package Manager for Microsoft Intune Administrators – Part 1
Deploying applications to end-user Windows machines has never been easier if you are a Microsoft Intune administrator. Earlier what used

Feb
02
2021
Major Cloud Concerns – Do corporate agents, cyber hackers, and governments have access to my data if it is in the cloud?
This is one of the major cloud concerns for many companies, but it is irrational. Your IT team manages access,

Jan
04
2021
How Global admin can give someone’s OneDrive access to another user?
Please follow the below steps to use this feature. Go to Admin Center https://admin.microsoft.com/ > User>Active Users> Search Name>Click on User Profile.

Dec
04
2020
Microsoft Secure Score
Microsoft Secure Score is a security analytics tool that provides better security configuration and security features. It applies a numerical

Dec
04
2020
Top 10 Elements of The Cloud
In this blog I will be talking about the Top 10 elements of Cloud. Virtual Network: Create a logically isolated section

Nov
04
2020
AWS CodePipeline
AWS CodePipeline is an Amazon Web Services tool that automates the app deployment process, enabling the developer to easily create,

Nov
03
2020
How Cloud Computing Can Improve Your Business?
Cloud computing provides users with access to files, applications, data, and services from their Internet-connected devices, such as smartphones, laptops,

Sept
04
2020
Visio Tabs in Microsoft Teams
Visio Tabs in Microsoft Teams allows team members in a dedicated space to access resources and information in a channel

Aug
04
2020
Cloud or On-prem? – All you need to know about moving to Office 365
Protection and uptime are usual for Office 365 in the cloud. Companies are generating data at an utterly impressive pace

Feb
09
2019
Remove Azure AAD Connect
Let’s see the steps to disable AD Sync, remove AAD connect and move to cloud-only administration. 1. Download Azure Active
No Comments